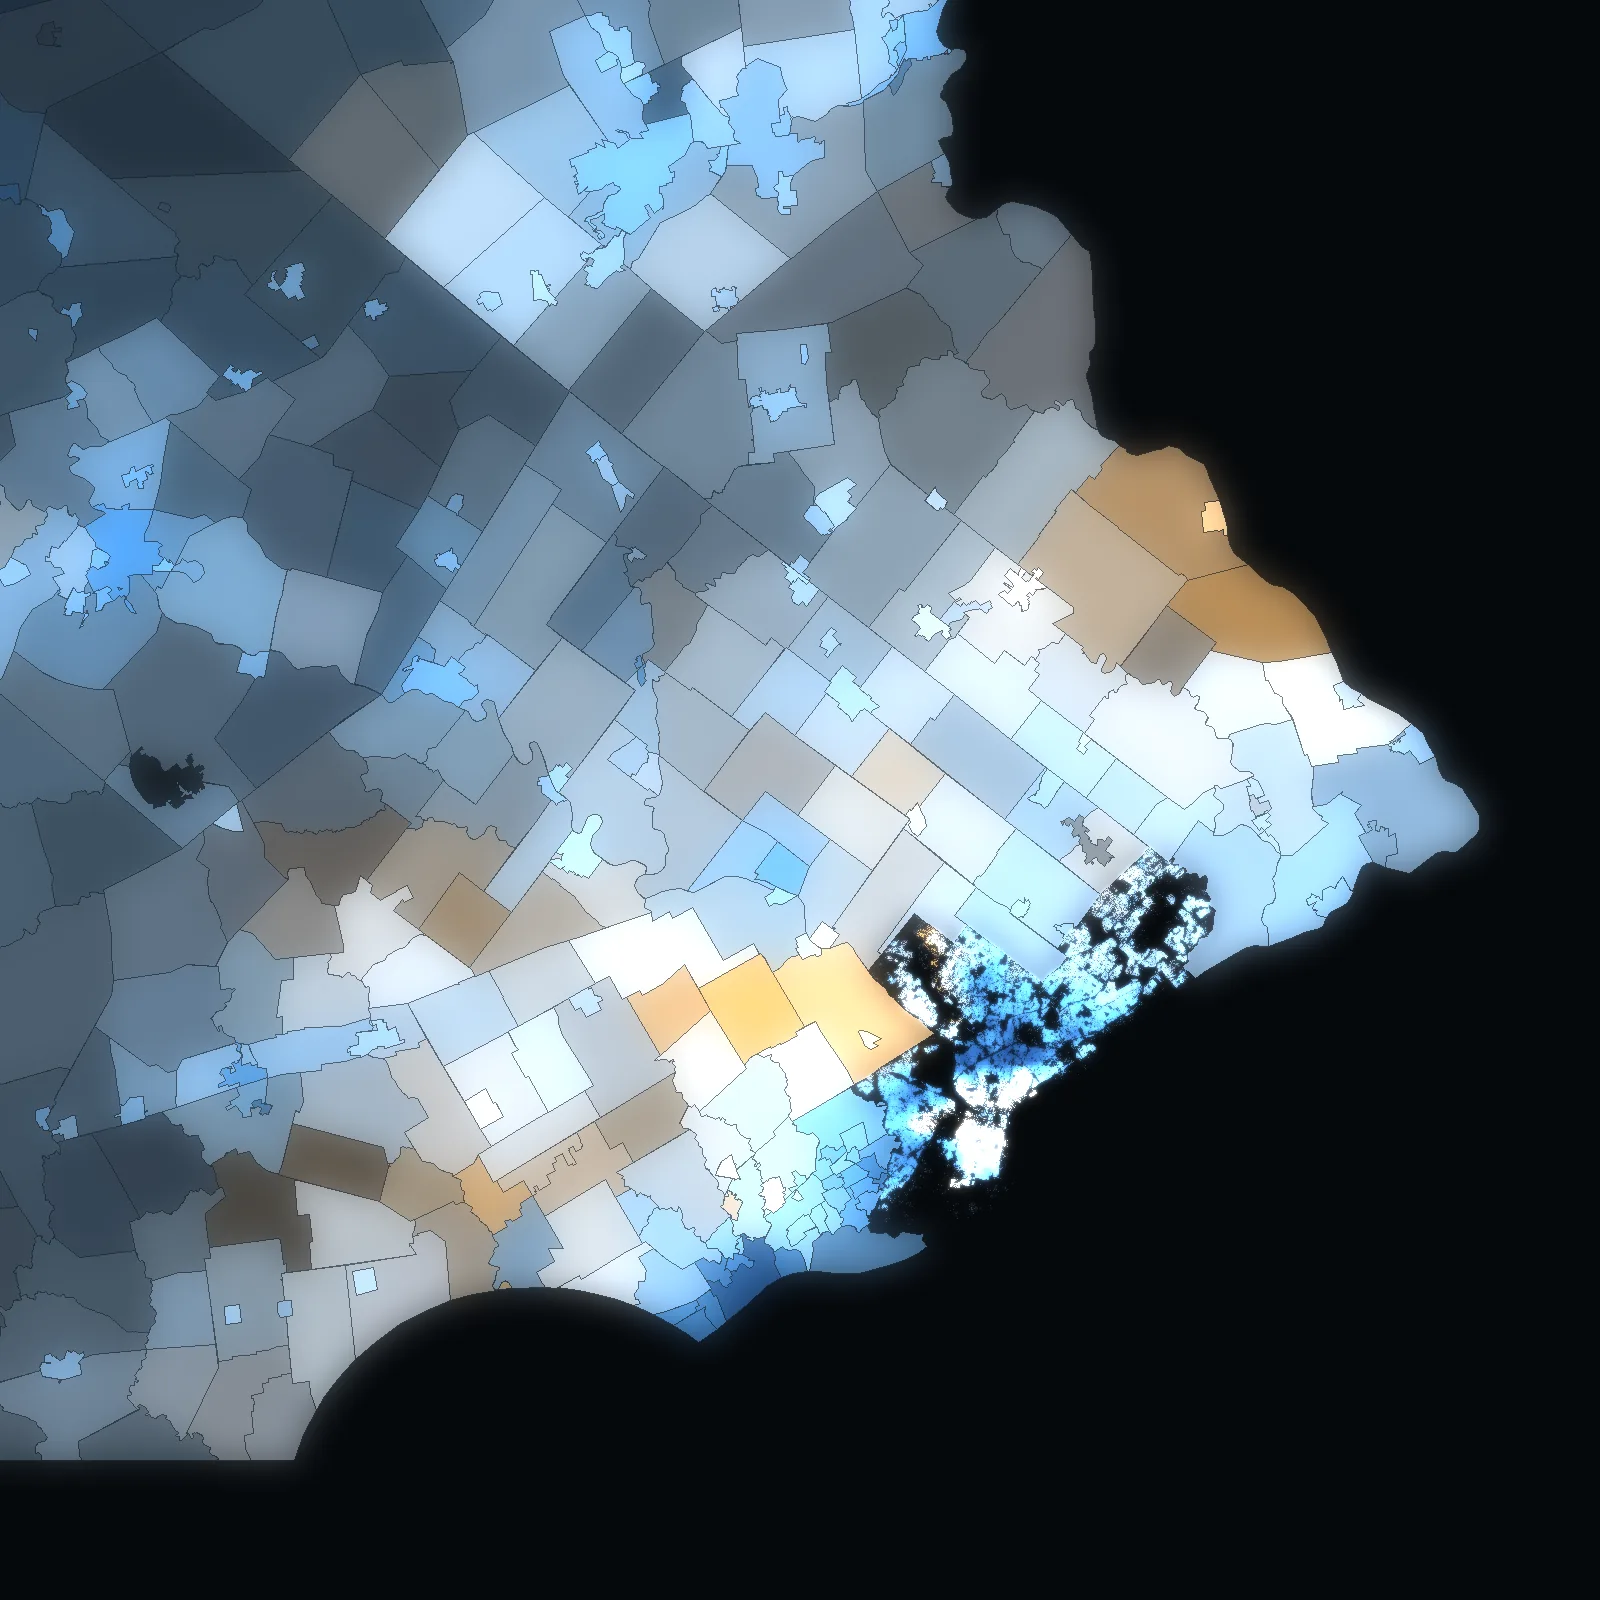
The State Tax Equalization Board’s sales (PA DCED, October 2021 – December 2025, by month). Medians from residential sales the State validated as valid sales, $10,000 or more, ten or more. Outlines: U.S. Census Bureau, TIGER/Line.
VPI OS · Pennsylvania · 67 counties · live
Every sale in Pennsylvania.
1,389,862 sales on the State’s record since October 2021, in all 67 counties and 2,561 municipalities – homes at a median of $280,000 (2023–2025), $300,000 in 2025.
Each county and town opens on its own map. Sales as the counties report them to the State Tax Equalization Board – by month, October 2021 to December 2025; the State publishes a calendar year at a time.
Pennsylvania State Tax Equalization Board · U.S. Census Bureau, TIGER/Line · the VERA PI databases. No buyers or sellers, no single sale. Counted .
County by county · Pennsylvania
Pick a county or a town. Its map opens.
All 67 counties and every city, borough and township with a sale on the State’s record – how many sales, the median of the valid home sales and the years since 2022. Philadelphia opens deed by deed. Each has its own address to share.
- Pennsylvania countyAllegheny County135,744 sales · 130 municipalitiesHomes $255k · 2025 $270k
- Pennsylvania countyPhiladelphia County79,903 sales · 1 municipalitiesHomes $255k · 2025 $290k
- Pennsylvania countyMontgomery County57,106 sales · 62 municipalitiesHomes $427k · 2025 $450k
- Pennsylvania countyYork County56,799 sales · 71 municipalitiesHomes $270k · 2025 $286k
- Pennsylvania countyBucks County55,277 sales · 54 municipalitiesHomes $462k · 2025 $489k
- Pennsylvania countyDelaware County51,600 sales · 49 municipalitiesHomes $300k · 2025 $322k
- Pennsylvania countyLancaster County47,420 sales · 60 municipalitiesHomes $337k · 2025 $355k
- Pennsylvania countyLuzerne County47,331 sales · 76 municipalitiesHomes $125k · 2025 $118k
- Pennsylvania countyWestmoreland County45,884 sales · 65 municipalitiesHomes $220k · 2025 $235k
- Pennsylvania countyBerks County41,734 sales · 73 municipalitiesHomes $255k · 2025 $280k
- Pennsylvania countyChester County38,346 sales · 73 municipalitiesHomes $500k · 2025 $520k
- Pennsylvania countyLehigh County35,374 sales · 25 municipalitiesHomes $320k · 2025 $335k
- Pennsylvania countyWashington County33,481 sales · 65 municipalitiesHomes $295k · 2025 $315k
- Pennsylvania countyMonroe County31,483 sales · 20 municipalitiesHomes $295k · 2025 $307k
- Pennsylvania countyNorthampton County31,403 sales · 38 municipalitiesHomes $327k · 2025 $340k
- Pennsylvania countyButler County28,550 sales · 57 municipalitiesHomes $350k · 2025 $365k
- Pennsylvania countyErie County28,316 sales · 38 municipalitiesHomes $195k · 2025 $212k
- Pennsylvania countyCumberland County28,239 sales · 33 municipalitiesHomes $335k · 2025 $335k
- Pennsylvania countyLackawanna County28,088 sales · 40 municipalitiesHomes $205k · 2025 $234k
- Pennsylvania countySchuylkill County27,170 sales · 67 municipalitiesHomes $115k · 2025 $120k
- Pennsylvania countyDauphin County26,087 sales · 40 municipalitiesHomes $240k · 2025 $260k
- Pennsylvania countyCambria County20,269 sales · 63 municipalitiesHomes $112k · 2025 $130k
- Pennsylvania countyPike County19,121 sales · 13 municipalitiesHomes $288k · 2025 $300k
- Pennsylvania countyBeaver County18,359 sales · 54 municipalitiesHomes $186k · 2025 $228k
Check a price · Pennsylvania
Where does the asking price sit?
Pick a county or a town and type the asking price. VERA PI places it against the median and the middle half (the 25th to the 75th percentile) of that town’s valid home sales – and says how many sales stand behind them. Across the state the middle half is $175,000 – $420,000.
VERA PI Market Brief · Pennsylvania
Any county or town in Pennsylvania.
Its sales on the State’s record year by year, its median and middle half, how it compares with its county and its neighbours – read from the VERA PI databases and checked by a person.
The method
Every sale on the State’s record, counted once.
Every figure on these pages comes from the sales Pennsylvania’s counties report to the State Tax Equalization Board – the county, the municipality, the month, the land use, the price and the State’s own validation of each sale – tied to the U.S. Census Bureau’s outlines of the counties and municipalities.
- Pennsylvania State Tax Equalization Board – All Sales Data 2021–2025 (PA DCED)1,389,862 sales of the 67 counties, October 2021 – December 2025, as the five annual workbooks publish them – the county, the municipality, the month, the land use, the price, the assessed value and the validation code; every municipality matched to its Census outline by name (four by hand)
- U.S. Census Bureau, TIGER/Line 2024the outlines of the 67 counties and of Pennsylvania’s cities, boroughs, townships and town
- City of Philadelphia – Real Estate Transfers (OpenDataPhilly)Philadelphia’s picture only: every deed with a consideration since 2021 at its point – never a count or a median on these pages
No buyers or sellers, no parcels, no documents – VERA PI keeps none of them for Pennsylvania; the pages show counts and medians of ten sales or more. A median uses the residential sales (the State’s land use 1000) that the State validated as valid sales (code 00), $10,000 or more: a multi-parcel sale, a sale between relatives, a sheriff’s sale and every other sale the State marks as not valid are counted among the sales on the record but never in a median. The State reports a month, not a day, and publishes a calendar year at a time, so 2026 is not here yet. The middle half is the 25th to the 75th percentile. Where a county’s own files overlap the State’s (Allegheny, Philadelphia), the State’s record alone gives the figures – two sources are never added together.
Sales: Pennsylvania State Tax Equalization Board, published by the Department of Community and Economic Development (the source). Outlines: U.S. Census Bureau, TIGER/Line. Philadelphia’s points: City of Philadelphia, Real Estate Transfers, under the City of Philadelphia License (OpenDataPhilly).