VPI OS · Massachusetts · 351 cities and towns · live
Every property in Massachusetts.
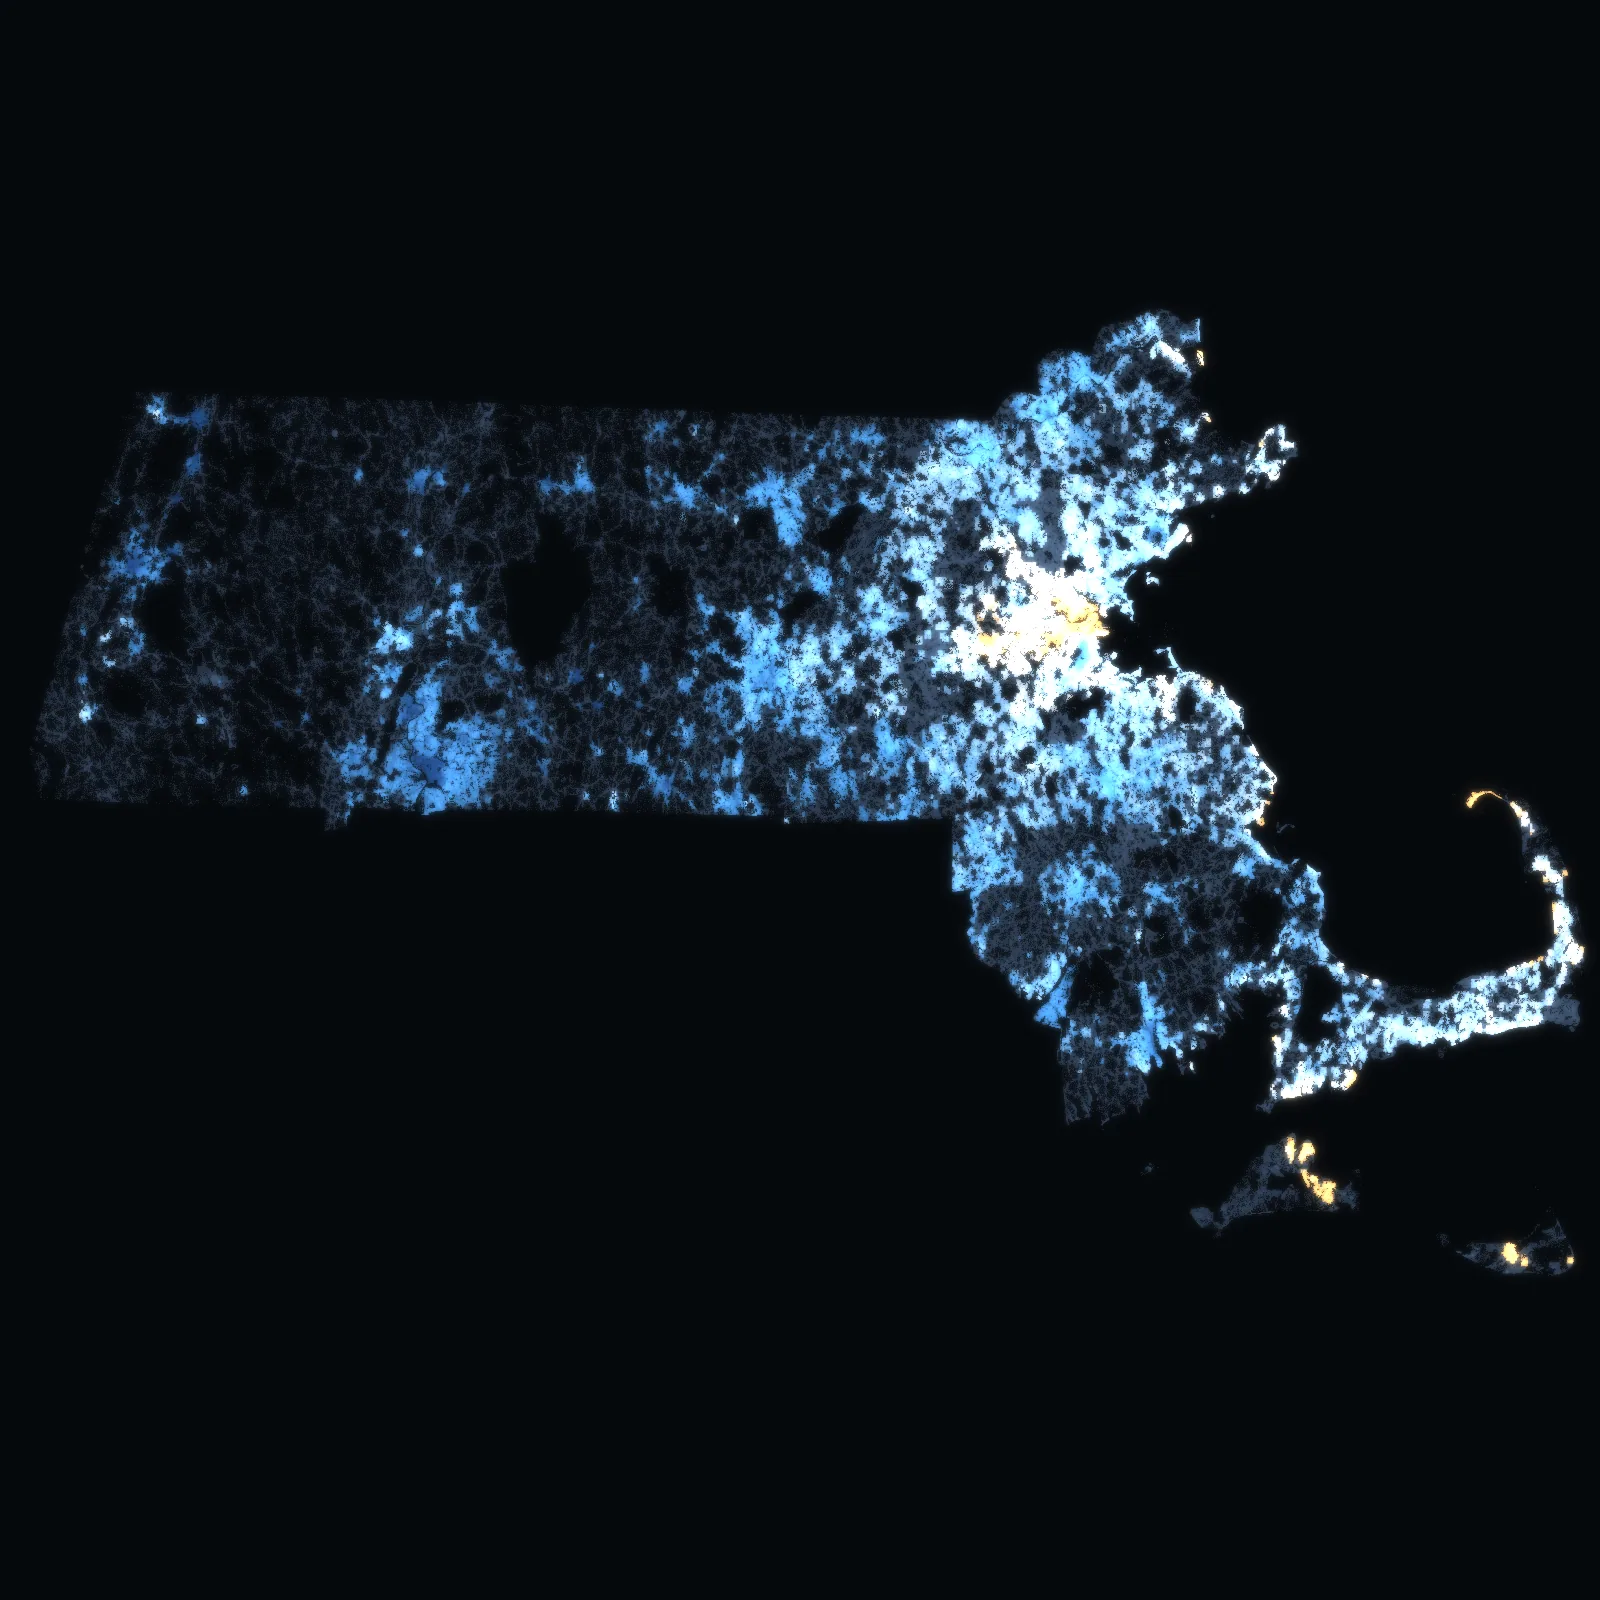
2,553,615 properties in the 351 cities and towns of Massachusetts – every parcel and condominium unit on the assessors’ latest rolls – with 1,051,295 sales the towns have reported since 2016, county by county and town by town.
Each city and town opens on its own map. Home sales January 2023 – December 2025 on the sales reports the towns file with the Department of Revenue, as far as each has reported.
MassGIS · the 351 assessors’ rolls · the Department of Revenue’s LA3 sales reports. No owner names. Counted .
Town by town · Massachusetts
Pick a county, then a city or town. Its map opens.
Every one of the 351 cities and towns – its properties on the map, the price per square foot of the homes sold around them, its medians and its neighbours. Each has its own address to share.
- Suffolk CountyBoston180,445 properties · 9,060 home salesHouses $815k · $533/sq ft
- Worcester CountyWorcester47,674 properties · 3,953 home salesHouses $427k · $302/sq ft
- Hampden CountySpringfield44,319 properties · 2,262 home salesHouses $285k · $220/sq ft
- Plymouth CountyPlymouth30,903 properties · 1,861 home salesHouses $650k · $338/sq ft
- Middlesex CountyNewton30,165 properties · 2,729 home salesHouses $1.80m · $730/sq ft
- Cape Cod · Barnstable CountyBarnstable29,262 properties · 1,051 home salesHouses $666k · $453/sq ft
- Middlesex CountyCambridge28,812 properties · 2,086 home salesHouses $2.20m · $1,108/sq ft
- Norfolk CountyQuincy28,307 properties · 1,360 home salesHouses $700k · $485/sq ft
- Middlesex CountyLowell28,102 properties · 1,851 home salesHouses $513k · $326/sq ft
- Plymouth CountyBrockton27,085 properties · 1,370 home salesHouses $485k · $334/sq ft
- Bristol CountyNew Bedford26,677 properties · 1,180 home salesHouses $400k · $293/sq ft
- Cape Cod · Barnstable CountyFalmouth24,989 properties · 808 home salesHouses $800k · $514/sq ft
- Bristol CountyFall River22,060 properties · 1,518 home salesHouses $435k · $253/sq ft
- Essex CountyLynn22,022 properties · 1,017 home salesHouses $575k · $421/sq ft
- Essex CountyHaverhill21,650 properties · 1,193 home salesHouses $550k · $307/sq ft
- Bristol CountyTaunton20,922 properties · 1,417 home salesHouses $520k · $335/sq ft
- Middlesex CountyFramingham20,887 properties · 1,031 home salesHouses $665k
- Norfolk CountyWeymouth20,383 properties · 1,724 home salesHouses $640k · $432/sq ft
- Middlesex CountySomerville19,001 properties · 1,895 home salesHouses $1.20m · $762/sq ft
- Middlesex CountyMedford18,569 properties · 1,481 home salesHouses $882k · $555/sq ft
- Hampden CountyChicopee18,533 properties · 1,206 home salesHouses $305k · $255/sq ft
- Berkshire CountyPittsfield18,341 properties · 1,137 home salesHouses $305k · $208/sq ft
- Norfolk CountyBrookline18,110 properties · 1,499 home salesHouses $2.54m · $861/sq ft
- Cape Cod · Barnstable CountyYarmouth18,086 properties · 1,267 home salesHouses $605k · $467/sq ft
VERA PI · Massachusetts
Four tools, one Commonwealth.
The same operating system as in France, New York and Florida, with the Massachusetts assessors’ rolls underneath: the property, its use and its areas, what sold on it and around it, its town and its county.
Check a price · Massachusetts
Where does the asking price sit?
Pick an address, the kind of home and the asking price. VERA PI places the price among the arm’s-length sales of homes like it within 500 m – the median, the middle half, the price per square foot and how many sales stand behind them.
The method
The assessors’ own rolls, joined on the parcel.
Every figure on these pages comes from the rolls of the 351 assessors as MassGIS publishes them – each property with its outline – and from the sales the towns report to the Department of Revenue, with their versions and dates. A property is its town and its assessor’s number; its outline, its use, its areas and its sales are joined on them by VERA PI.
- MassGIS – Level 3 assessors’ parcels, all 351 cities and townsevery property: its use code, its land, its building, its year built, its living area, its rooms and its address – and the outline of its parcel, from each town’s latest roll
- Massachusetts Department of Revenue – LA3 sales reports (Division of Local Services)every sale the towns report, with its non-arm’s-length code, October 2016 – June 2026; a transfer reported in several years counted once by VERA PI
- MassGIS – municipalities (TOWNSSURVEY)the 351 cities and towns and their 14 counties
- USGS – NAIP orthoimagerythe aerial photograph under VERA PI Map
No owner names, ever, and no buyer or seller. Sales are shown as counts and as medians of ten or more, with their period and radius; a sale the town marks as not at arm’s length is never in a median, and a transfer reported in several years counts once. A price per square foot only ever divides by the living area of the home sold on the roll – a condominium unit’s own area. An assessment is not a market value.