Residential sales (single family, condo, two to four family) with no non-use code, $10,000 or more, by the date recorded – the towns' sales the State's OPM collects; medians of ten or more. Outlines: U.S. Census Bureau, TIGER/Line 2024.
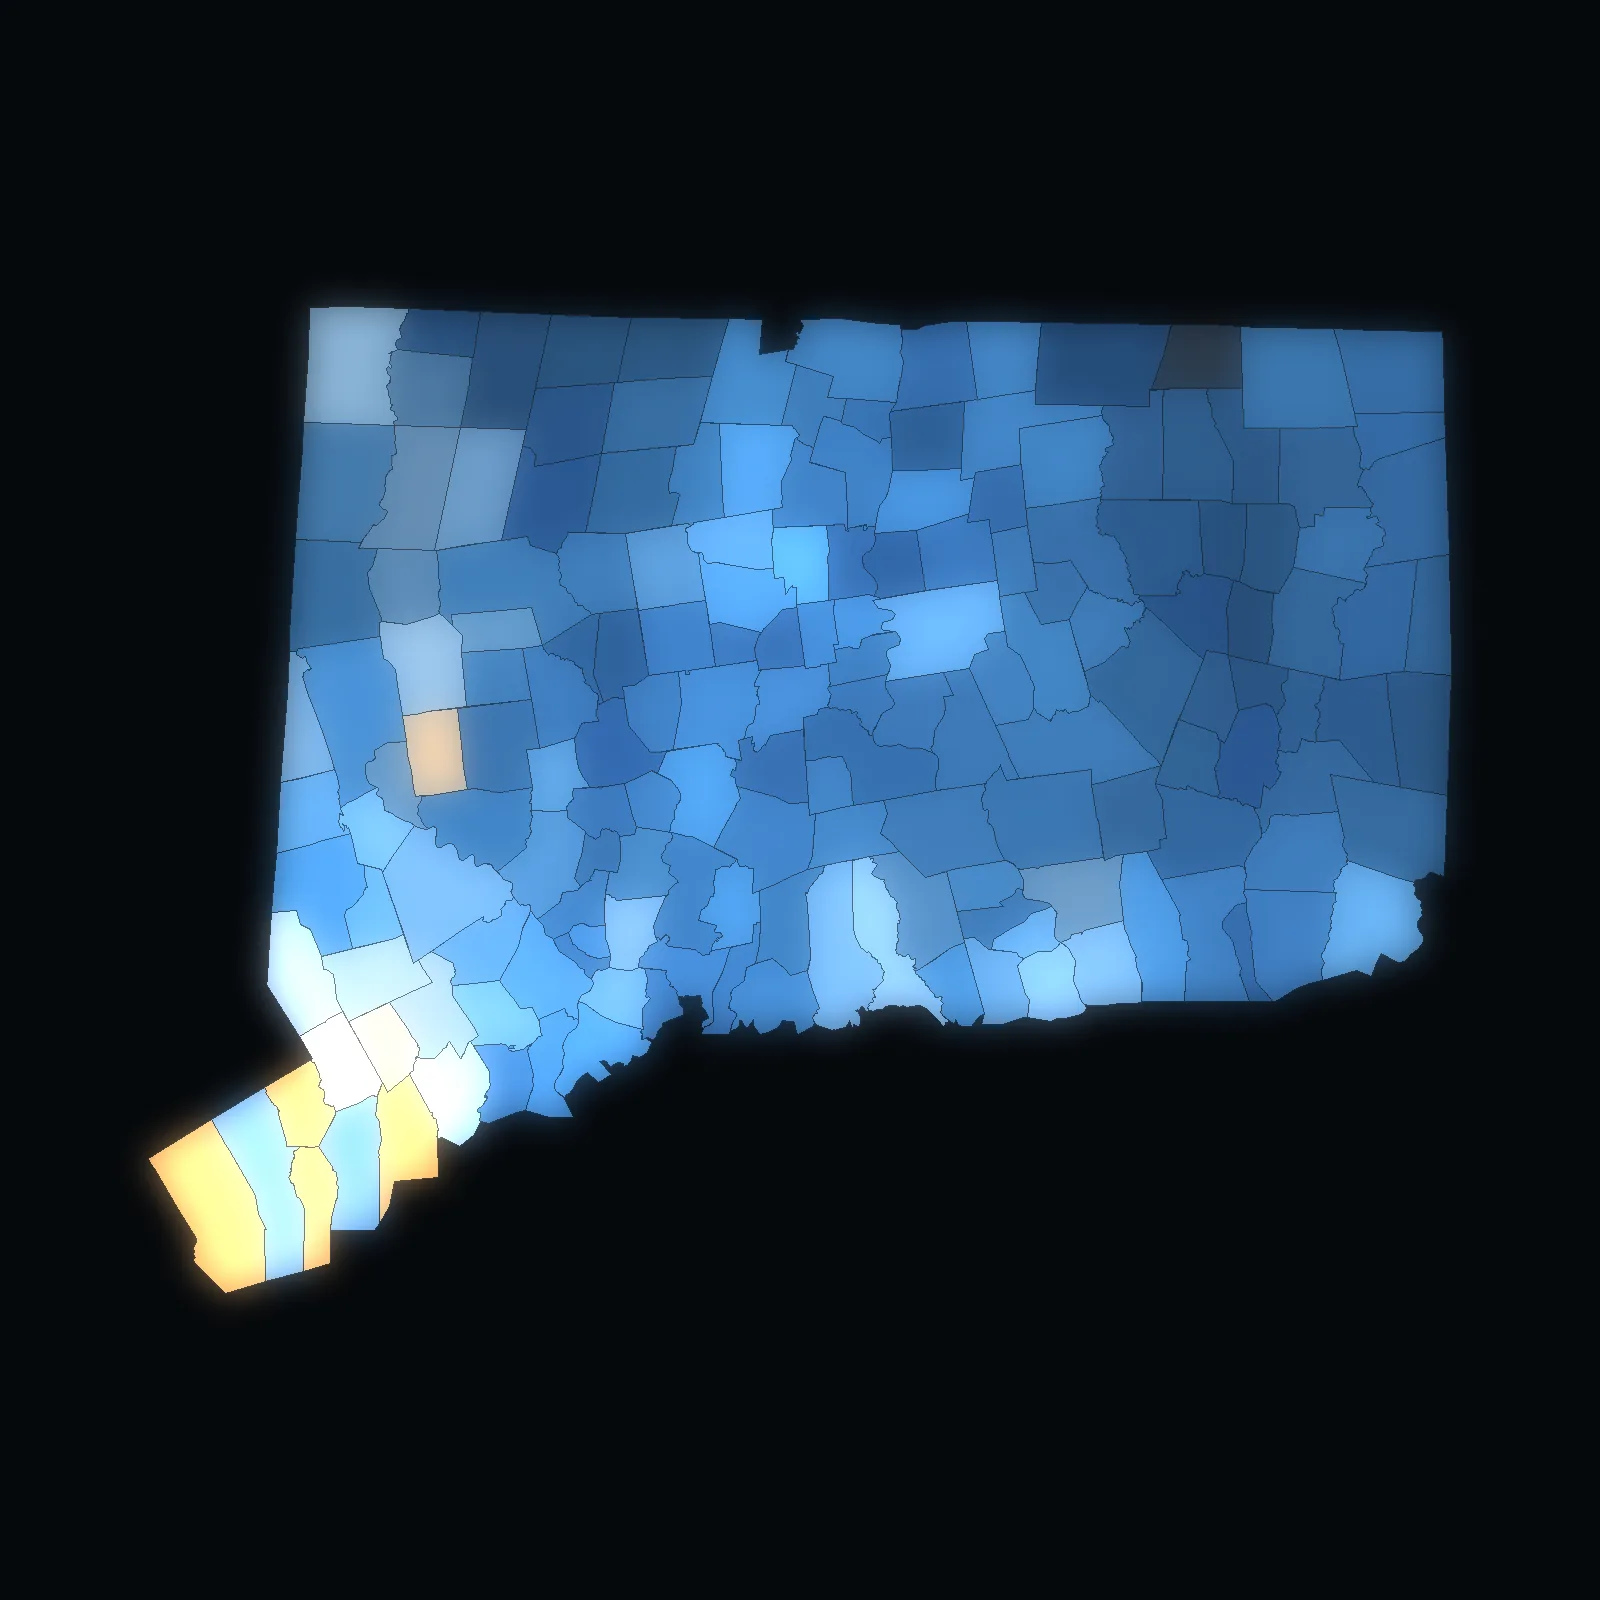
VPI OS · Connecticut · 9 planning regions · live
Every parcel in Connecticut.
1,249,928 parcels in 9 planning regions and 169 towns – homes at a median of $380,000 (2023–2025).
Each planning region and town opens on its own map.
State of Connecticut OPM · State of Connecticut OPM · U.S. Census Bureau, TIGER/Line · the VERA PI databases. No owners, buyers or sellers, no single sale. Counted .
Planning region by planning region · Connecticut
Pick a planning region or a town. Its map opens.
- Connecticut · planning regionCapitol Planning Region337,108 parcels · 38 townsHomes $340k
- Connecticut · planning regionSouth Central Connecticut Planning Region184,247 parcels · 15 townsHomes $355k
- Connecticut · planning regionWestern Connecticut Planning Region184,066 parcels · 18 townsHomes $700k
- Connecticut · planning regionNaugatuck Valley Planning Region155,734 parcels · 19 townsHomes $330k
- Connecticut · planning regionSoutheastern Connecticut Planning Region110,163 parcels · 19 townsHomes $336k
- Connecticut · planning regionGreater Bridgeport Planning Region87,800 parcels · 6 townsHomes $450k
- Connecticut · planning regionLower Connecticut River Valley Planning Region84,056 parcels · 17 townsHomes $390k
- Connecticut · planning regionNorthwest Hills Planning Region60,712 parcels · 21 townsHomes $327k
- Connecticut · planning regionNortheastern Connecticut Planning Region46,042 parcels · 16 townsHomes $345k
Check a price · Connecticut
Where does the asking price sit?
Pick a planning region or a town and type the asking price. VERA PI places it against the median and the middle half (the 25th to the 75th percentile) of that place’s home sales – and says how many sales stand behind them.
VERA PI Market Brief · Connecticut
Any planning region or town in Connecticut.
Its parcels and its sales year by year, its median and middle half, how it compares with its planning region and its neighbours – read from the VERA PI databases and checked by a person.
The method
Every parcel in the state’s open layer, counted once.
Every figure on these pages comes from Connecticut CAMA and Parcel Layer 2025 (OPM) and residential sales (single family, condo, two to four family) with no non-use code, $10,000 or more, by the date recorded, tied to the U.S. Census Bureau’s outlines of the planning regions and towns.
- State of Connecticut OPM – Connecticut CAMA and Parcel Layer 2025the parcels of the 169 towns (counted by town and its GIS-CAMA link)
- State of Connecticut OPM – Real Estate Sales 2001–2024 GL (data.ct.gov 5mzw-sjtu)the towns' sales: date recorded, sale amount, residential type, non-use code
- U.S. Census Bureau, TIGER/Line 2024 – counties and county subdivisionsthe outlines of the counties and towns on the maps and the cards
No owners, buyers or sellers, no parcel lookup and no single sale – VERA PI shows parcel counts (every distinct parcel ID once) and medians of ten home sales or more; the middle half is the 25th to the 75th percentile. An assessed value is never shown as a value.